How Relative Yield is Created
Premier Crop creates a data layer from the yield file that is relative to 100, a procedure that is sometimes called normalizing yield.
Corn Example:
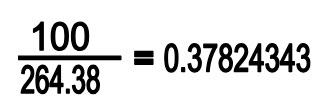
Take the maximum yield value in the field and set that as 100 by dividing 100 by the max. Use this factor as the multiplier for all other data points in the field.
Actual Yield Field Max = 264.38

Each yield value in the rest of the field is multiplied by this factor. This scales the yield to all fall under 100, which we then represent on a map as a value between 0-100, allowing us to see high and low performing areas regardless of crop.
As a check: 264.38 x 0.3782434374763598 = 100

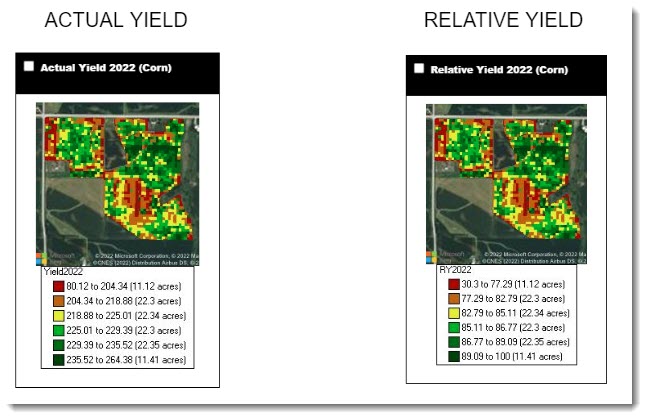
Note that the scale on the legend changes, but the yield map colors remain the same.