Applying a data filter to your dashboard filter
To apply field filters and rules to the data source used as a dashboard filter and have the dashboard filter show only the employees in the London, UK office (as in the example above), follow these steps:
-
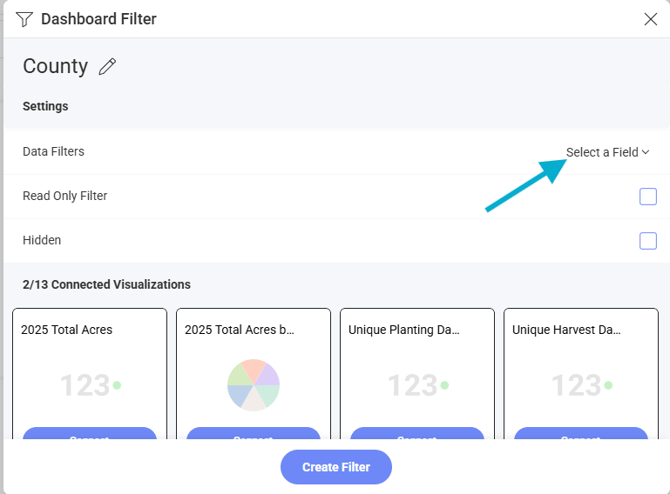
Go to Data Filters in Dashboard Filter settings.
-
Select County for the Field property.
-
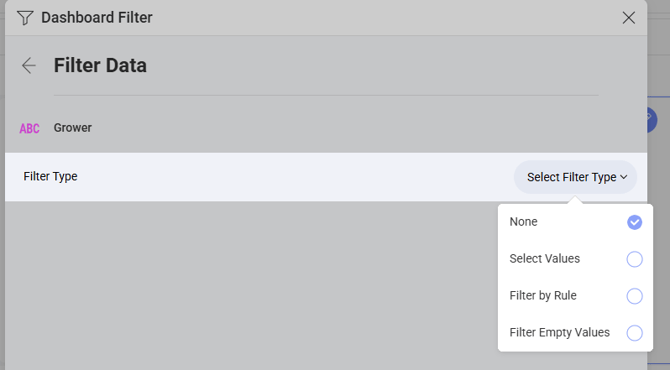
Click/tap on Select a Field and choose Grower from the list.
- Choose whether to select certain values, filter by a rule (numerical or date) or Filter Empty Values
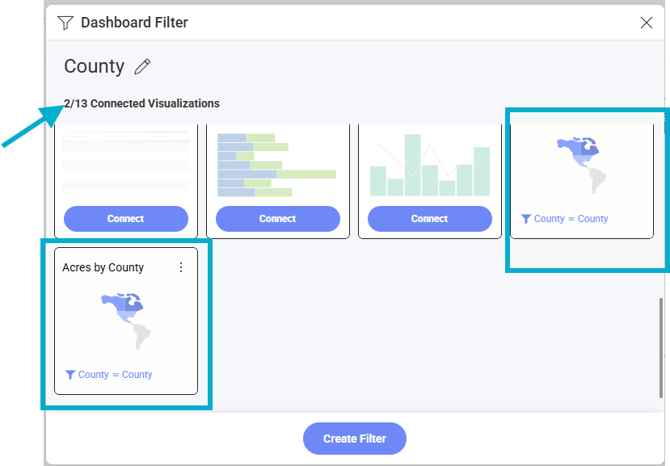
Connected Visualizations to Filters
5. Next, choose whether your filter applies to all visualizations in the dashboard, or you can manually disconnect some visuals.
Tip: In order to create benchmarking visuals, you may choose to apply a Grower filter to some visuals, but leave other visuals at the large group level and be sure to name them correctly. This way, when you filter at the top of your dashboard, some visuals will reflect how a grower performed against the group.