- Once you are in the Dashboard, click on the data in the legend that you wish to hide.
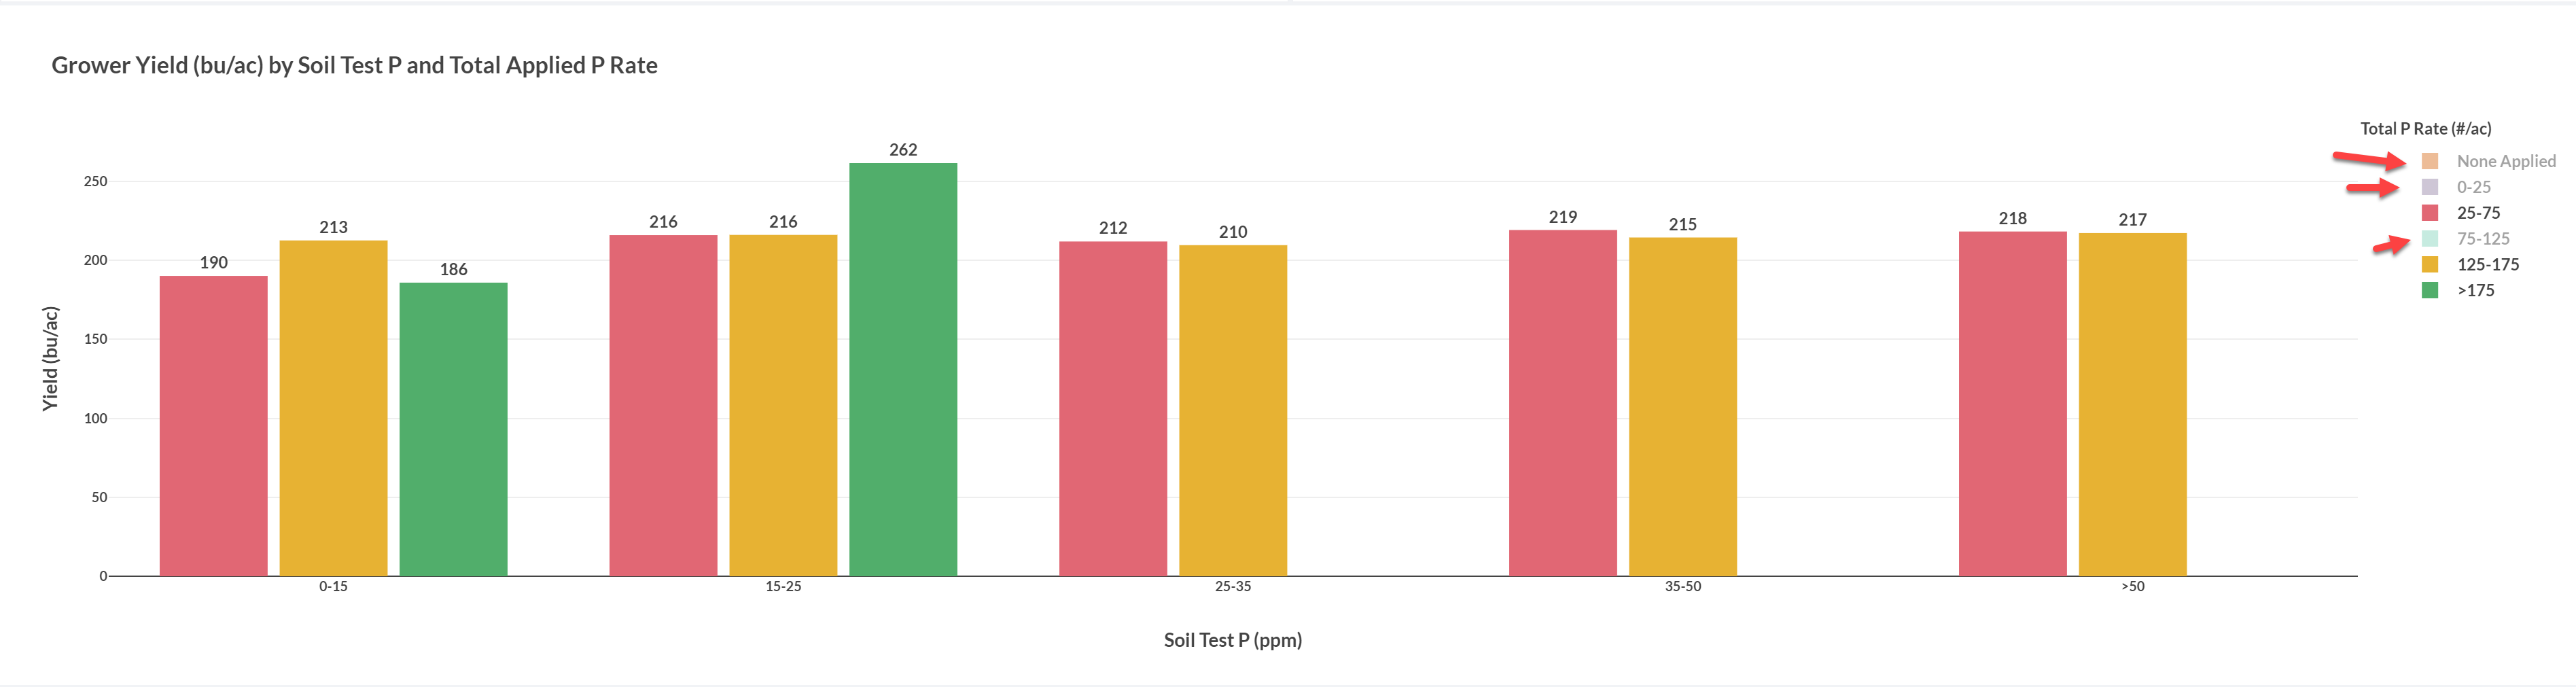
- To view the data, click on it to have it be visible again.
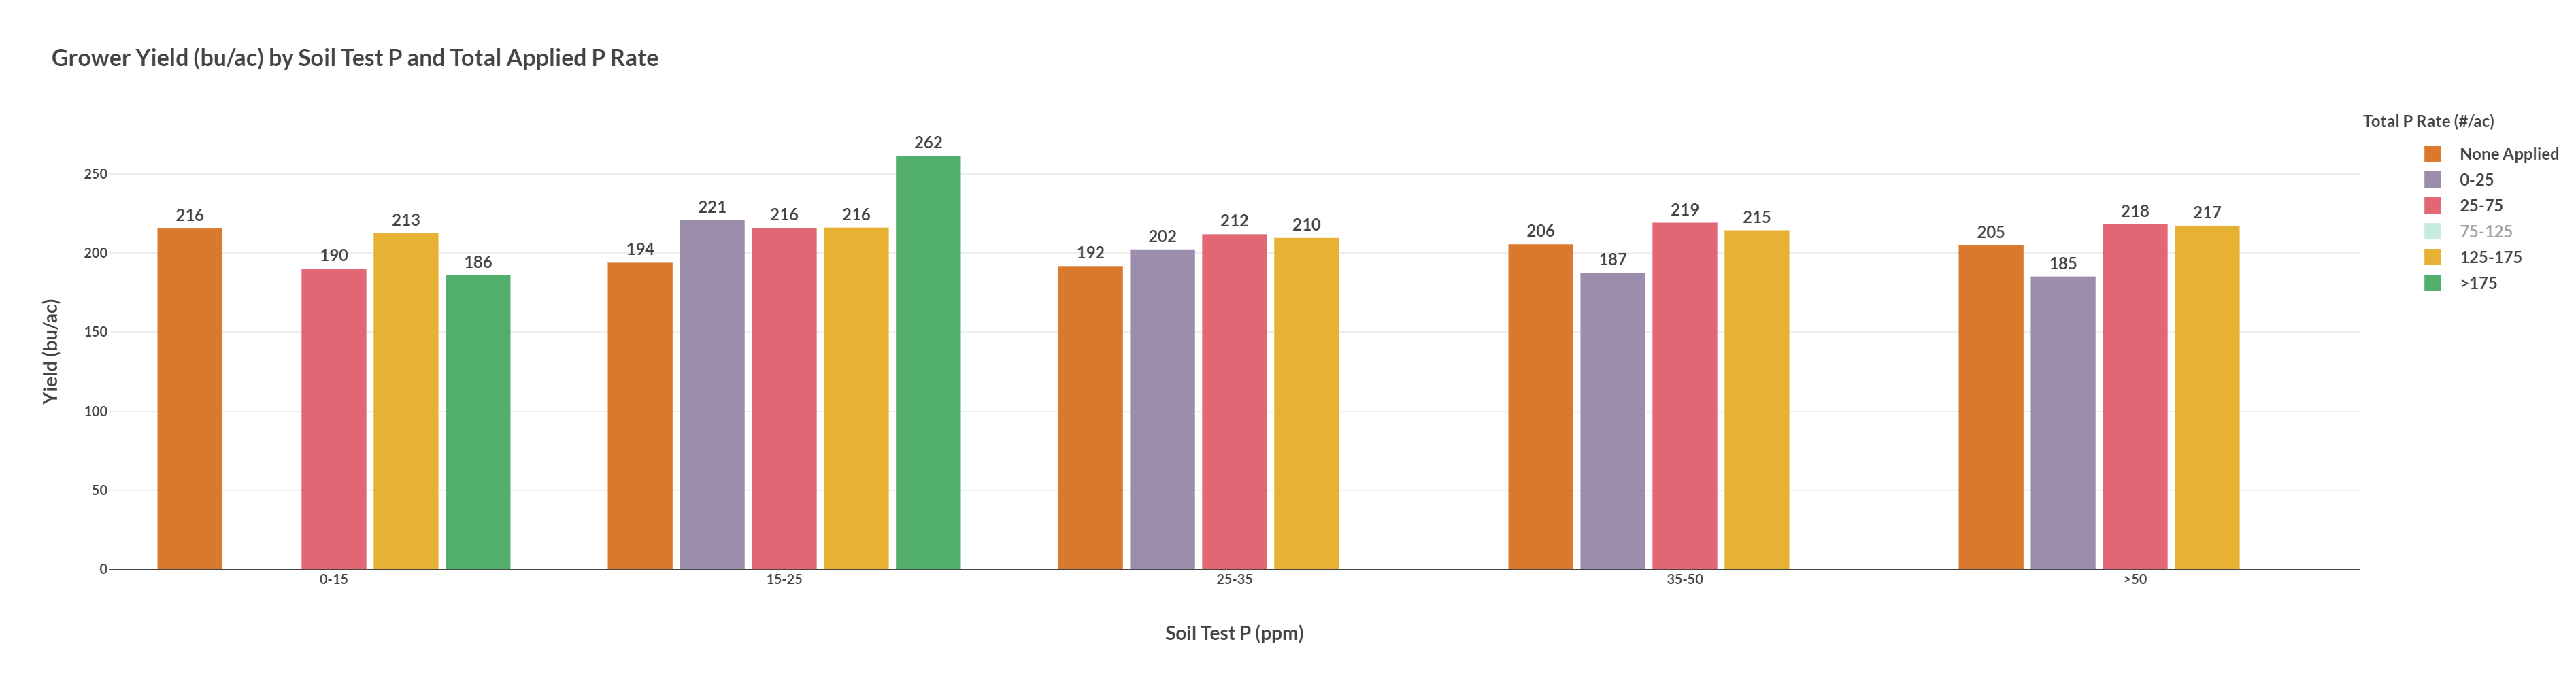
- This can be done for any of the Data Visualizations:
Field vs Grower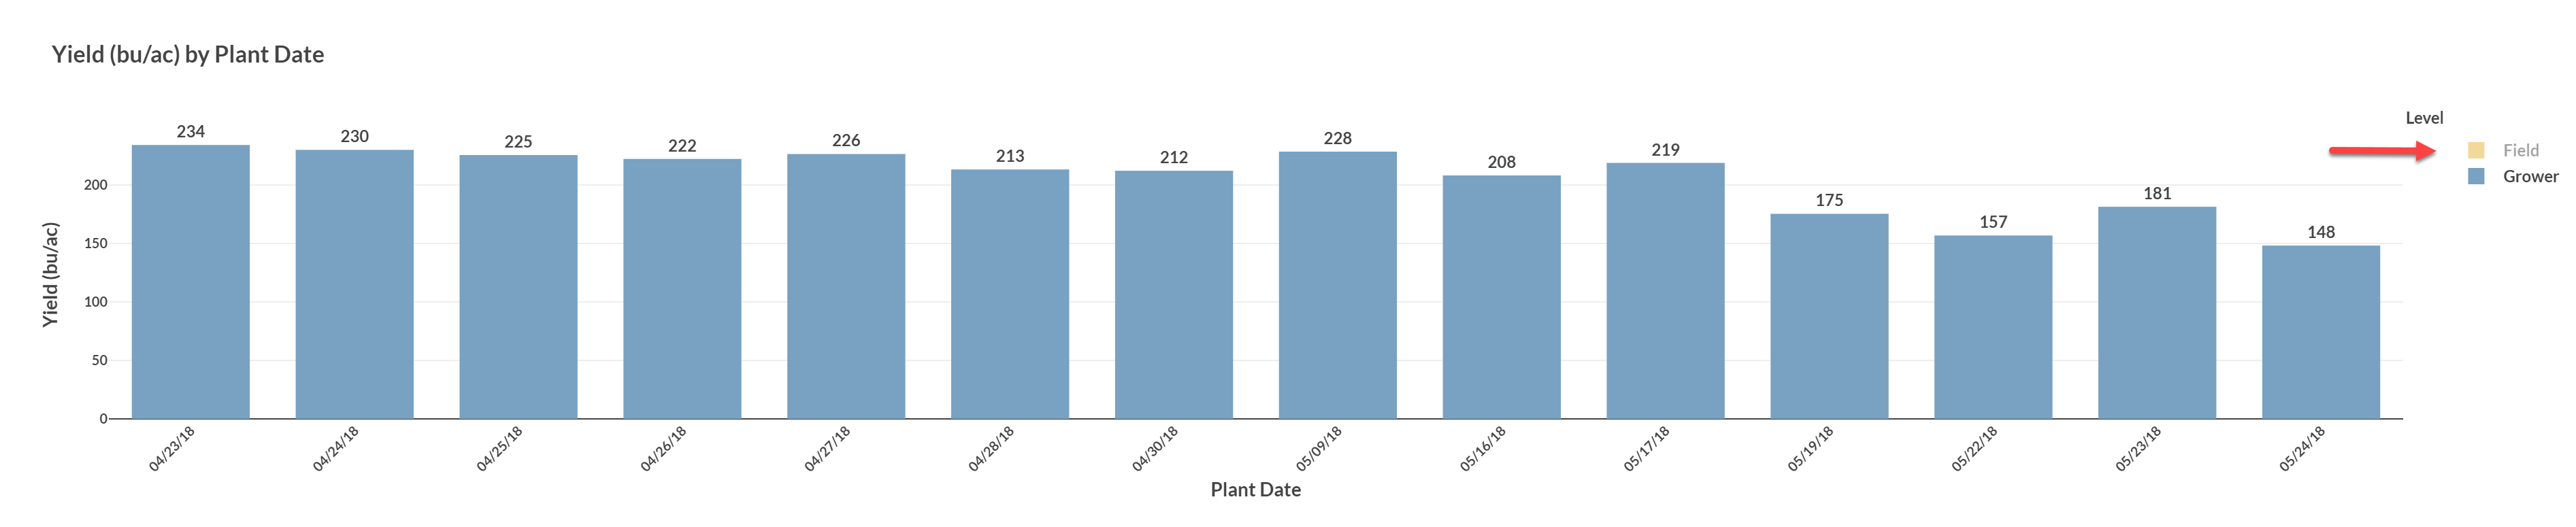
Group vs Grower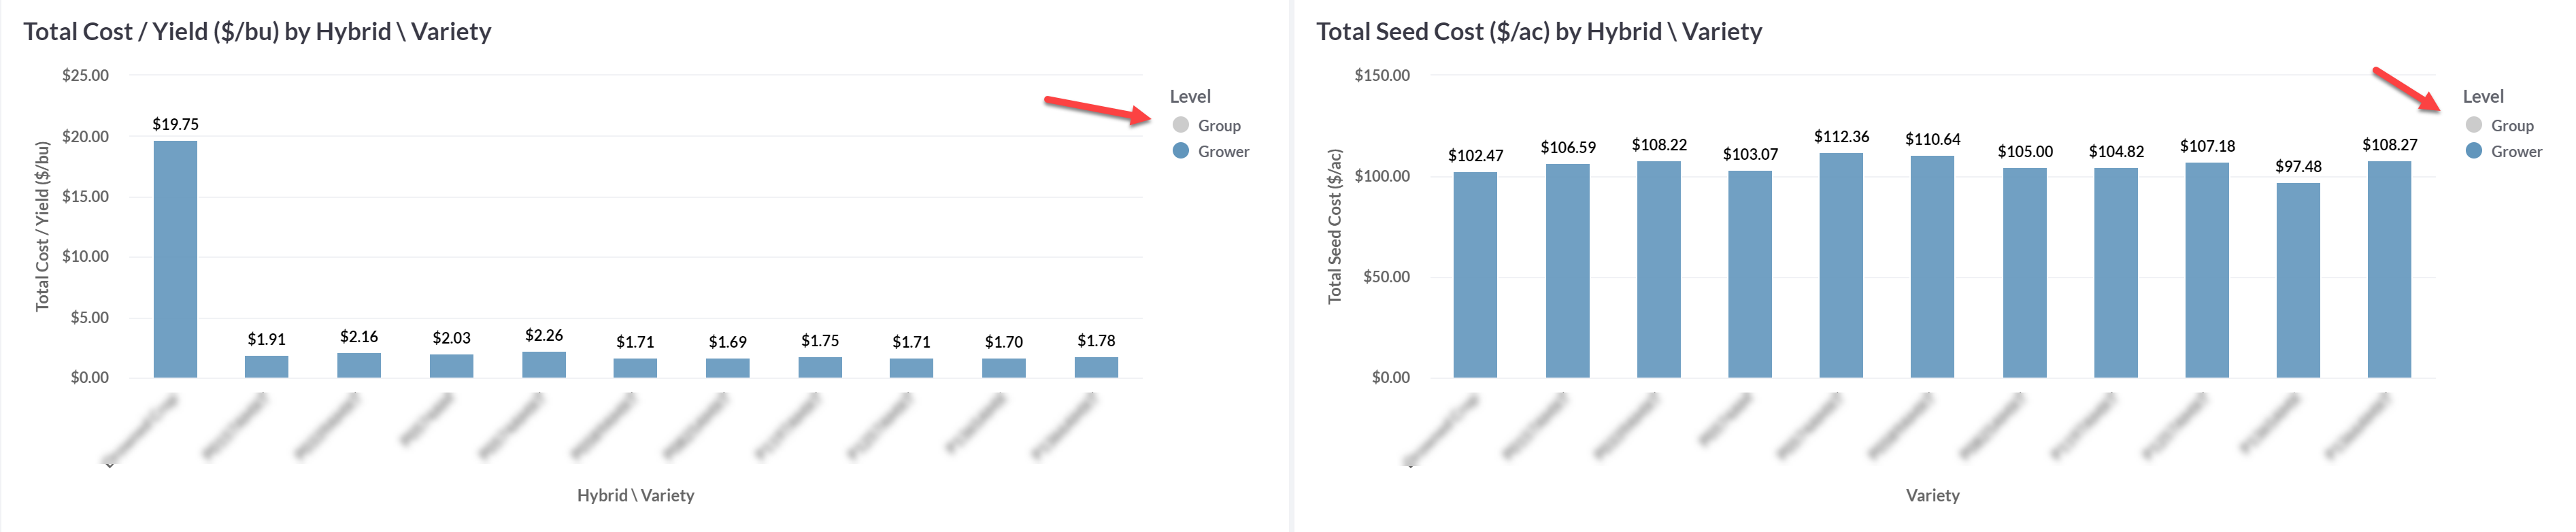
Production Costs
Yield vs Yield Efficiency
Hybrid/Variety by Area
- If you have any questions, please contact your advisor support representative.
Even if you hide data, if/when you download the PDF, the PDF will contain all of the data, not just that that is being displayed.