It's important to understand that a "Top Ten Report" is going to show you which attributes are either directly or inversely correlated MORE THAN .10 with yield.
Correlation Table
- A quick way to dive into the data and know where to look for correlations.
- Red is an INVERSE correlation, not a negative correlation.
- If you do not understand Correlation, check out the Understanding Correlation Premier Process.
- Check: The wider the rate range the bigger the correlation factor.
Let's look at this example:
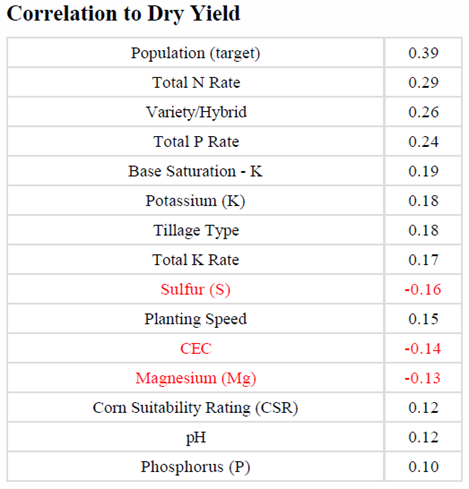
- It is important to know that Total P Rate (or any "Total X Rate") is applied nutrients.

- Whereas, Phosphorus (P) (or any "Nutrient (N)") is referencing soil test values.

Time to dig into the rest of the report!
Premier 10-20 Classification
- Designed to pull out and show variability across a field.
- Does a great job of showing unevenness across different attributes to combat: "My fields don't have variability. They are pretty much the same."


- For the 270.5 acres (bottom 10% yielding 142 bu/ac, with a range of 17.14 - 163.25 bu/ac) in this Top Ten Report, have an average Soil Test Potassium value of 241 ppm, whereas, the top 10% yielding (257 bu/ac), has an average Soil Test Potassium value of 300 ppm. Although it bounces around in values in the bottom 50%, clearly the top 50% of these acres has higher Soil Test Potassium values.
- Notice how as yield increases that Avg K (Potassium) also increases.
- Conversely, look at Avg CEC (Cation Exchange Capacity): As yields increased, the average CEC decreased.

- Notice that the rate of applied nutrients also directly correlated to yields increasing.
- You can see that the nitrogen usage or efficiency varies, as well as the Ndex™ value.
- Manure applications can make for large applied nutrient differences across a grower's operation!
Inverse Correlation Questions:
- Why would you have inverse correlations to applied fertilizer? (N Rate P Rate, K Rate)
- High soil test fertility to begin with?
- Zones not classified correctly?
- Not using Management Zone Recs with the latest soil tests and calibrated yield files?
- Drowned out areas of fields?
- Sometimes it’s inevitable.
- Why would you have inverse correlations to soil test fertility?
- Flat rate fertilizer spreading for years will cause this.
- The high soil test areas are lower productivity and the low soil test areas have been mined and are of high productivity.
- Not a long term recipe for success.
- Drowned out areas?
- Manure applications?
- High soil test values to begin with?
- “It’s not about the reports, or overwhelming the grower with paper or tables of data. It’s really about what you, the advisor, learn from the reports and point out to the grower so you both can learn, manage the details, and make improvements for the Grower's operation.”