Before you can run the Dashboards for a Grower, you must have a group created and set the access for that grower in that group.
- Once logged into your PCS account, click on the "Dashboards" tab and then click on the "Grower Benchmarks" option.

- Navigate to the Branch and Grower that you are wanting to Benchmark.

- Select the Year and the Group in which you want to Benchmark the Grower's data against.
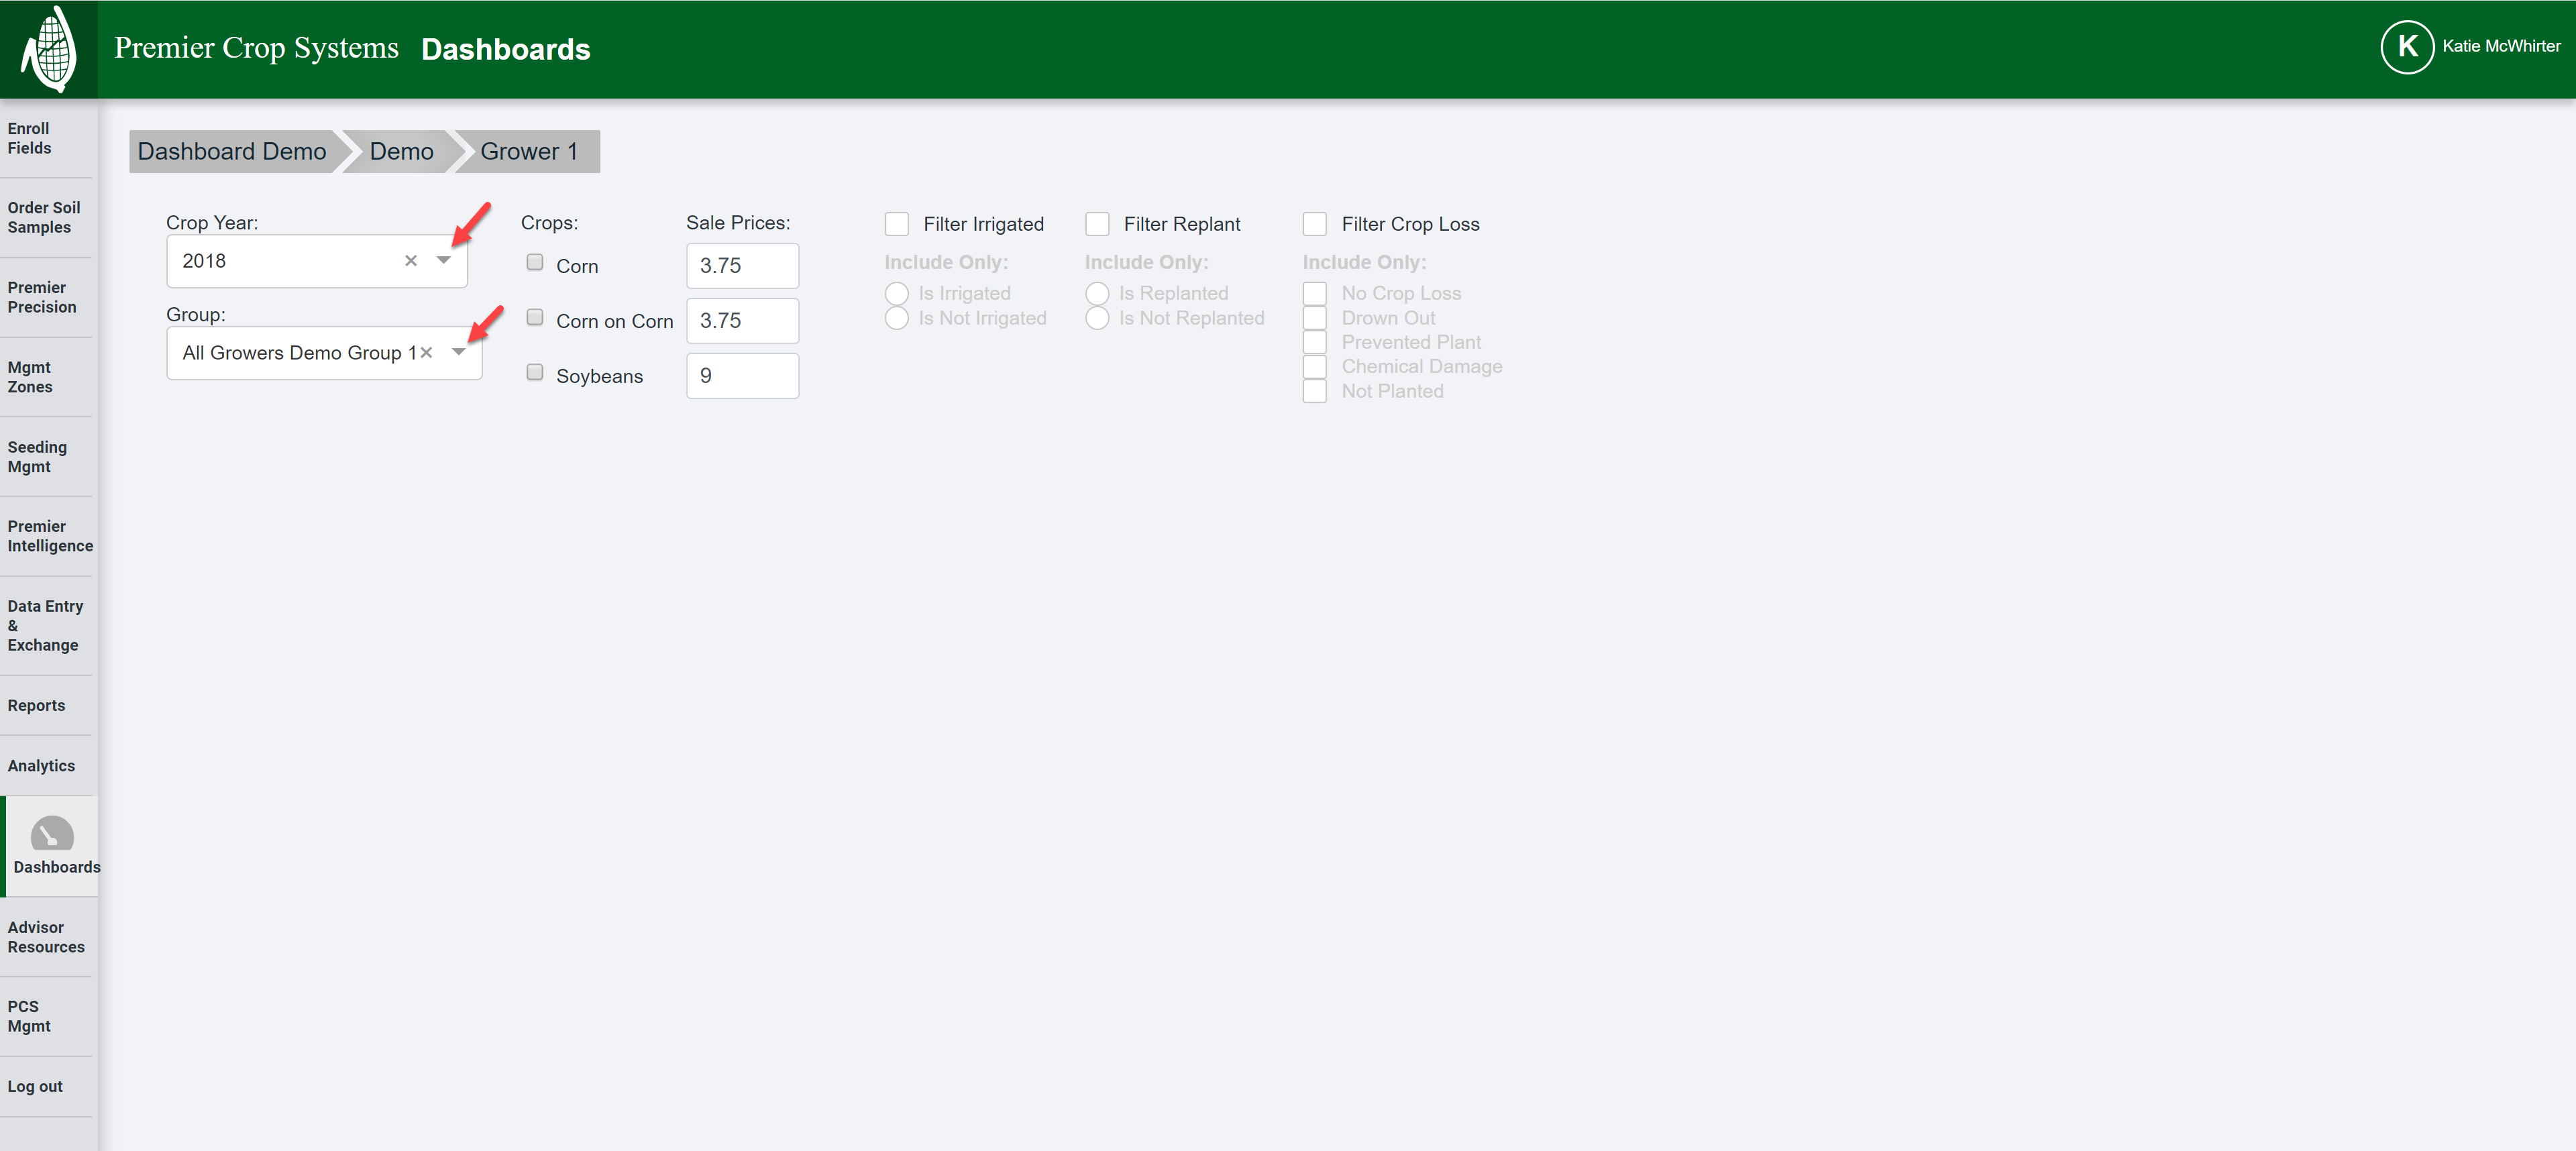
- Next select the Crop(s) that are wanting to Benchmark and set the Sale Price(s) for these. These values will remain for this grower only and will only change if you change them. Most of the time, you will want to keep crops separate, but for the Economics Dashboard, it is valuable to see across the Crops how profitability differs.

- Filter any data that you wish to.
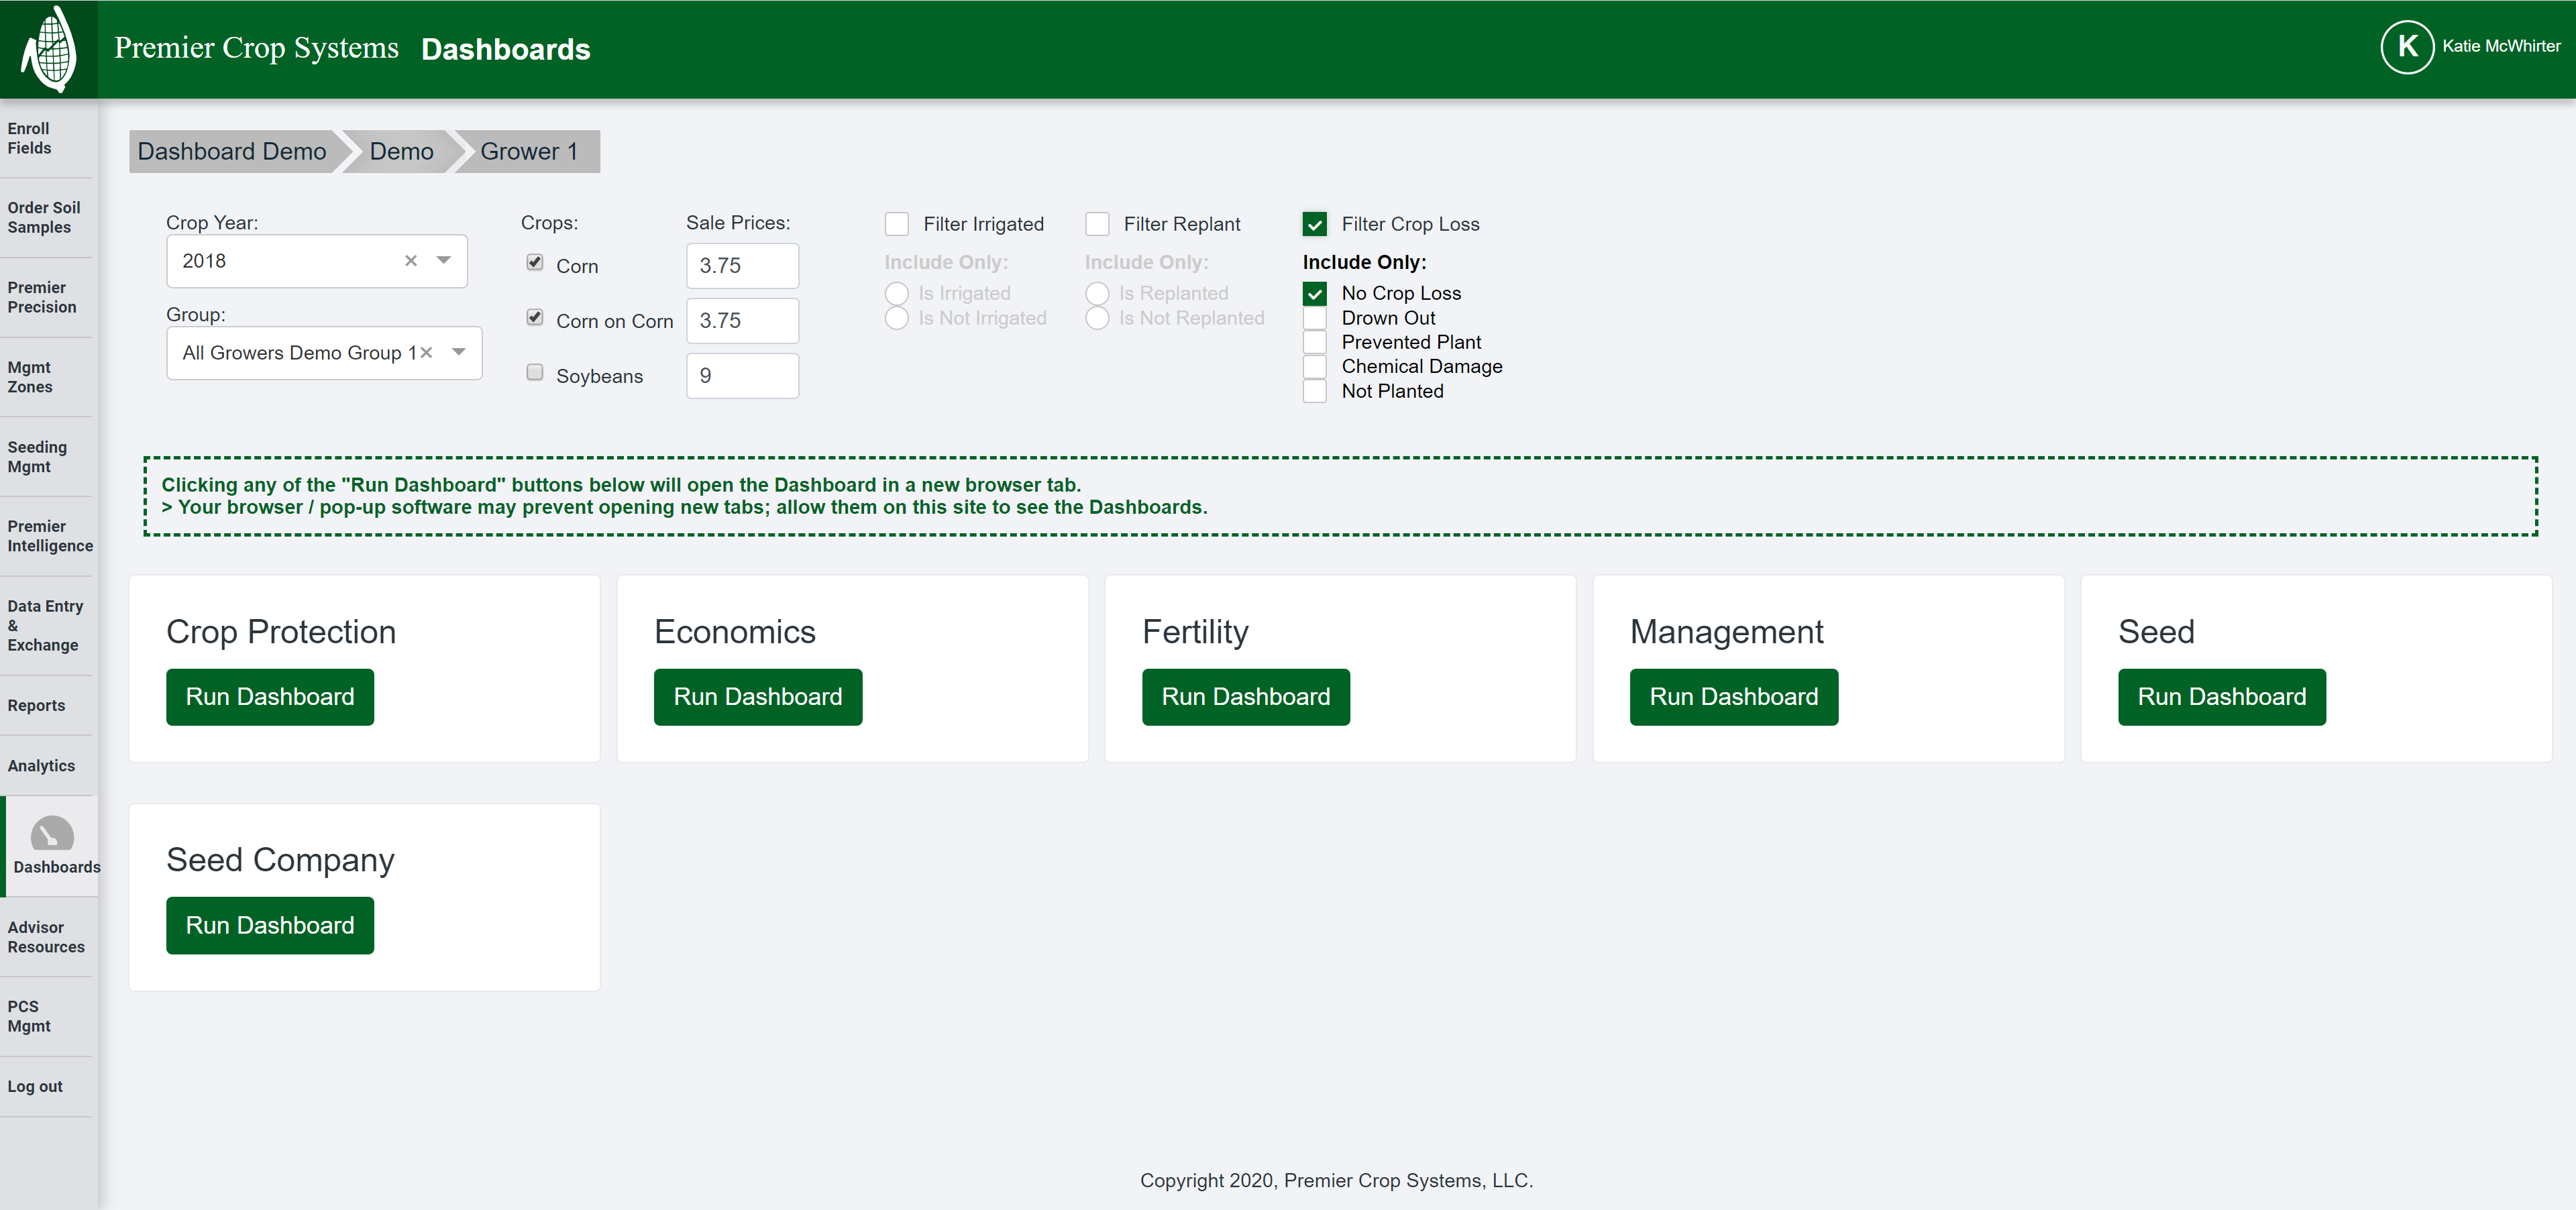
- You can now run any of the Dashboards by clicking on the appropriate button(s).
- You may need to change your pop-up settings to allow the Dashboards to run.
- Each time you run one of the dashboards, it will open in a new tab in your browser.
- If you have any questions, contact your advisor support representative.