- The first component of this report is an overview of the General information collected on the field.

- This is just great to refresh what happened on the field, call out anything that may be different on this field. For this field, we notice that our Actual Planting Rate and our Intended Planting Rates are very different. Gives us a reason to look at these two and see what happened? Equipment malfunction? Didn't execute the prescription? Scaled the prescription?
- Next we see the Cost map and legend


- The Legend is set up in the Premier 10-20 Ranges:
- Top 10% most profitable areas of the field in dark green
- The next 20% most profitable in the next shade of green
- The next 20% most profitable in the lightest shade of green
- So forth until you see the least 10% profitable parts of the field in red
- The Legend is set up in the Premier 10-20 Ranges:
- Breaking out the soil test values into their ranges and seeing how yield correlates to them is shown in the next section of this report:
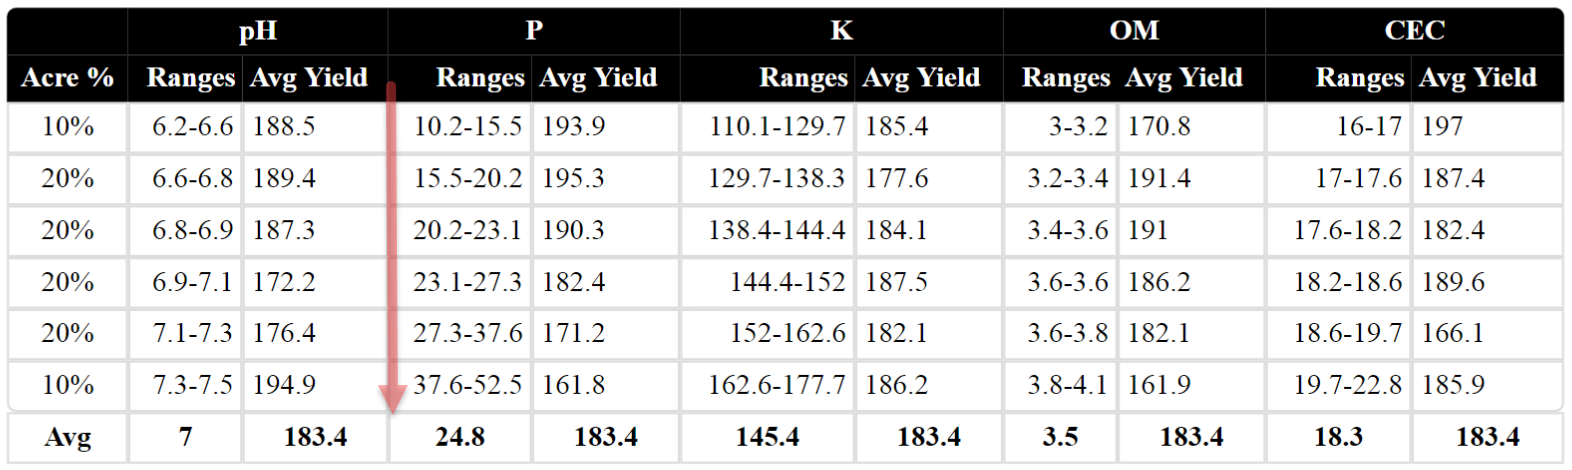
- Again, the report breaks out the values by the Premier 10-20 ranges.
- Notice on this field how the the bottom 10% of acres with soil test P (Phosphorus) values from 10.2-15.5 Yielded 193.9. After soil test values got over 20.2, yields started to decrease. Since this grower is NOT using their yield field and has fertilizing at a build to one specific ppm value, they have mined down in those top producing areas.
- Seeding information is displayed next:

- This section will compare the different hybrid(s) and/or variety(ies) that were planted in the field and specifically compare:
- Average Yield
- Average % Moisture
- The acres that each was planted on
- The Cost ($)/acre for each seed hybrid
- The $/bu for each
- For this example, even though one hybrid out yielded the other by over 16 bu/acre, it cost more per acre and the cost/bu was higher. A great conversation with a grower about how yield does not always equal profitability!!!
- This section will compare the different hybrid(s) and/or variety(ies) that were planted in the field and specifically compare:
- Applied Nutrients are listed next with their rates, types, and timing, as well as the overall applied nutrient amounts.
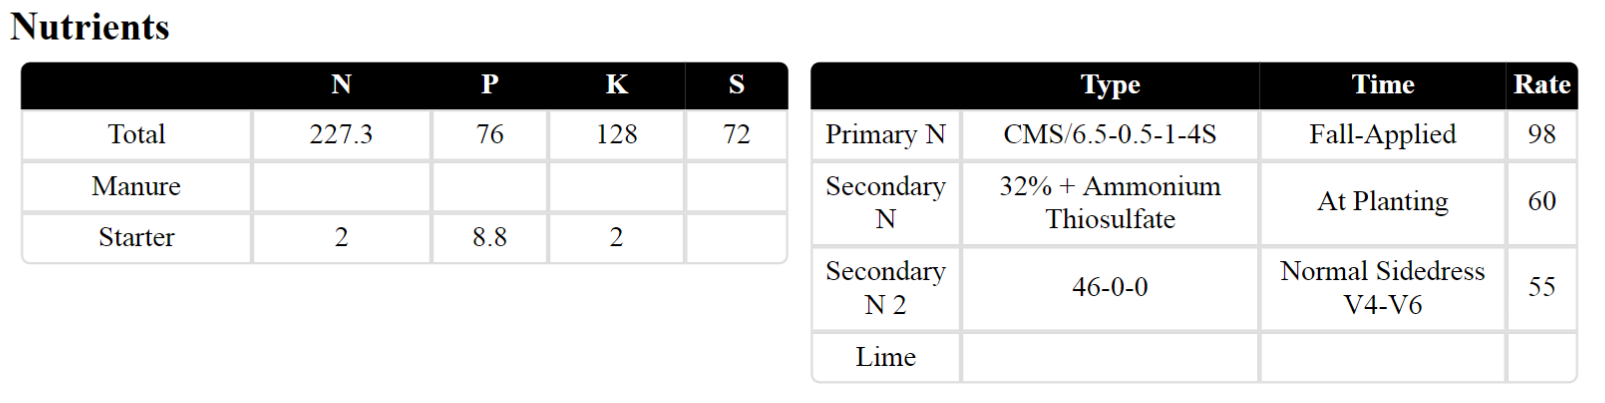
- These are field averages, so if a nutrient was applied spatially, it will call that data out in this report.
- Applied Herbicides, Insecticides, Fungicides, and Seed Treatments are listed with their:
- Product Type
- Timing
- Product
- Rate
- Units

- You may want to talk with a grower about the chemical program(s) that were used, if they felt that they worked, adjustments that should have been made, etc.
- Growing Environment is listed next in this report.

- If weather was an issue, looking at the average Cumulative GDU's (Growing Degree Units) and/or Rainfall may be helpful.
- In the case of corn, the equation is: GDD or GDU = (Daily Maximum Air Temperature + Daily Minimum Temperature)/2 – 50
- If weather was an issue, looking at the average Cumulative GDU's (Growing Degree Units) and/or Rainfall may be helpful.
- Last on this report is the Average Production Costs table.

- This breaks out all inputs by the Cost per Acre ($/ac) and the Cost of Production ($/bu).
- May lead to talking points about the costs for a particular input, their cost of operations, etc.
- Remember, changing production and/or profitability for a field can only be done with what the grower has available, so using their data and their resources to find ways to be more profitable is key!