This module is intended to help you understand who Premier Crop is and what we help you to provide your customers
The Year was 1999...
A gallon of gas cost $1.22.

The average price of corn was $1.72/bu.
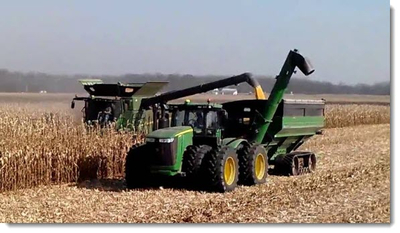
GPS receivers and little black boxes had begun to show up on harvest equipment.
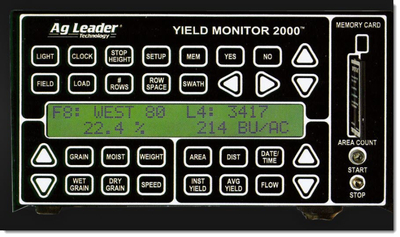
And for the first time, farmers were given the ability to visualize and quantify variability within their fields!
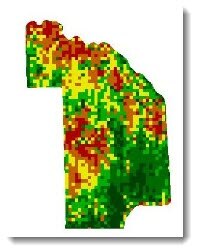
Adding one more piece of data to the overabundance of data that Growers were (and still are!) collecting!
Premier Crop Systems was founded to help Growers and their trusted Agronomic Advisors to:
- Organize data into a database structure that allows you to see the relationship between all the layers of data that you can collect.
- Provides tools that show previously hidden relationships.
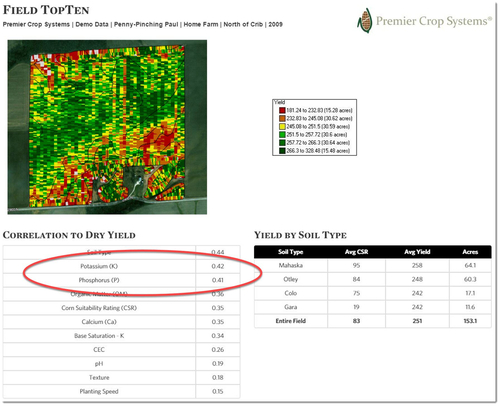

- Provides analysis at the sub field, field and grower level and across thousands of confidentially pooled acres.
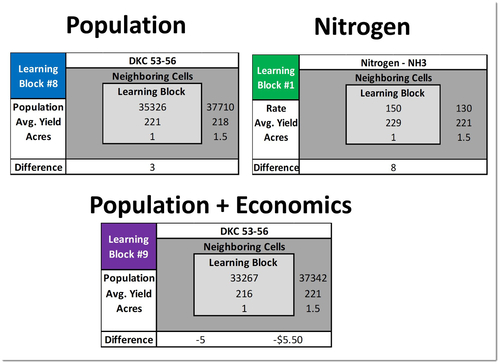

Premier Crop is an Agronomy Company that looks like a software company.
What does this mean to Premier Crop?
Agronomy is complex and a software cannot simplify it.
- Agronomy is LOCAL.
- Every field is different.
- Yield
- Fertility
- Rented vs. Owned
- All fields should be treated as unique.
- The financials for every Grower is unique.
Advisors using Premier Crop should understand the way to USE the data and realize its limitations.
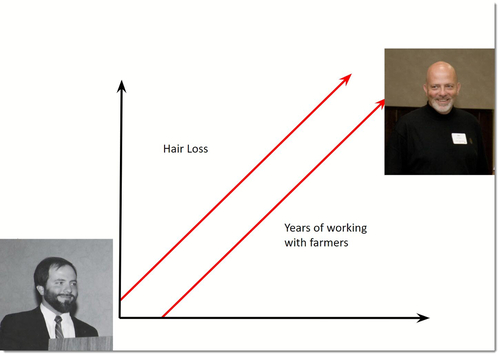
Although funny, realize that just because correlations appear in the data, it may not be the sole reason for the causation.
Let's look at a more realistic example:

