Once in a chart, click to the Settings tab. Scroll down until you see Axis Bounds and enter a value that works better for your data.
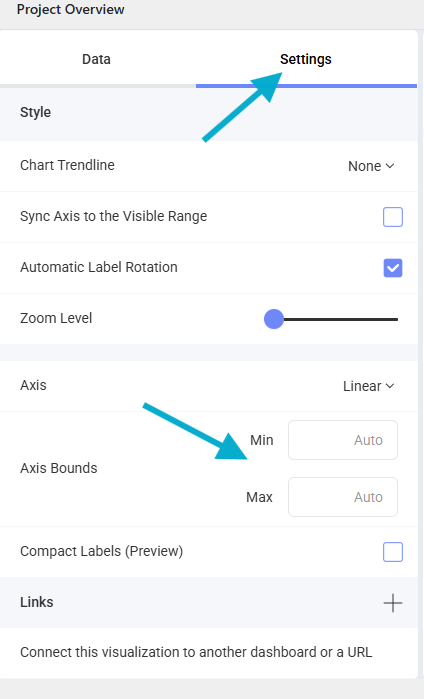
Keep in mind - if you use drill downs or dashboard filters, leaving this on auto will ensure the data can always be viewed.