Standard deviation is a measure of the amount of variation or dispersion of a set of values.
- A low number means that the values do not vary much from the average.
- A higher number means that the values are spread out away from the average.
At Premier Crop, we use it as a value that helps with the confidence of the average value that we obtained in our queries.
For example, if you ran this query and it gave you these results:
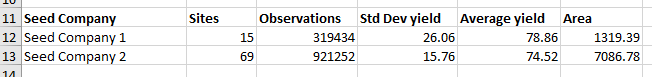
At first glance, you would see that Seed Company 1 out yielded Seed Company 2 by over 4 bushels. Looks great, right? However, when we look at the Std Dev yield column, we see that Seed Company 1 had a standard deviation number of 26.06. Seed Company 2, although yielded 4 bushels less, it has a standard deviation number of 15.76.
What does this all mean?
- For Seed Company 1: ~2/3 of the yield data was +/- 26.06 bushels from that average yield of 78.86 bu/ac. In other words, 67% of the yield data fell between 104.92 - 52.8 bushels per acre.
- For Seed Company 2: ~2/3 of the yield data was +/- 15.76 bushels from that average yield of 74.52 bu/ac. In other words, 67% of the yield data fell between 58.76 - 90.28 bushels per acre.
- Company 1 has a higher yield, but Company 2's yield was more consistent. AND the even bigger story is that it is more consistent on 6 times the amount of acres that it was planted on!
This is a more honest way of looking at data, as averages do not tell the whole story.