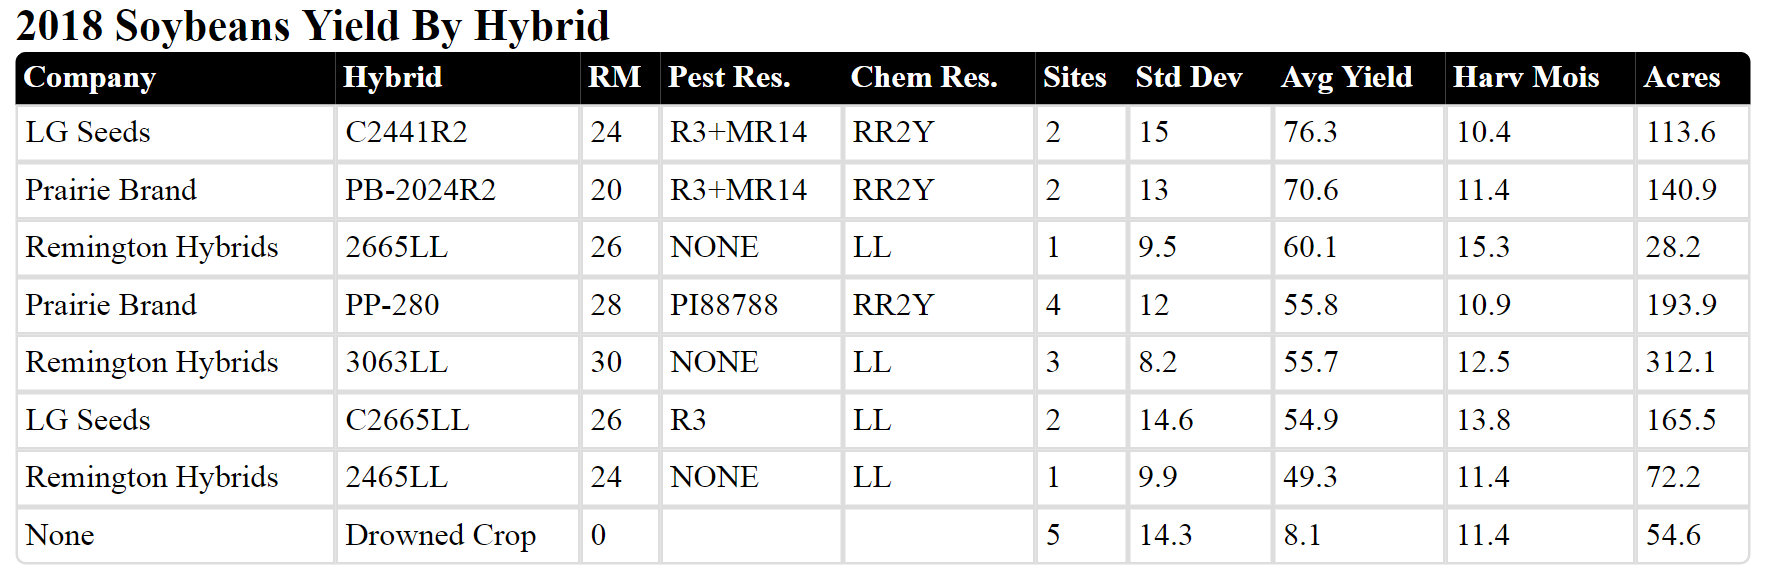
- The first component of this report is the Yield by Hybrid table. Growers want to see how their hybrids performed over all of their fields. This table will include:
- Seed Company
- Seed Hybrid/Variety
- Relative Maturity
- Pest Resistance Traits
- Chemical Resistance Traits
- Number of Sites that these varieties/hybrids were planted on. Sites = Fields
- Standard Deviation (if you need more information on this, click on this informational link: Understanding Standard Deviation)
- Average Yield
- Average Harvest Moisture
- Acres that the hybrid/variety was planted on. If you have no yield for a part of field, but the hybrid/variety was planted on all if it, the acres will be reflected in the total.
- Next in this report is the Yield by Soil Texture table, looking at the Grower's averages by the difference soil textures.

This is an easy look into soil textures and if we're managing them correctly or should we hone in and see if we can manage them better than what we currently are.
- The Yield by Top Soils chart will list out the yields by the most common soil types across crop type.

- The Yield by Individual Field chart will rank the fields from top to bottom by average yield.

- You will then see how the axis has been flipped between yield and attribute to see relationships in the data in the last section! It will be grouped together by the Premier 10-20 again, this time by these different attributes. The 10% will be lowest 10% of that attribute (pH, P, K, RM, etc.), then the next 20%, and so forth.
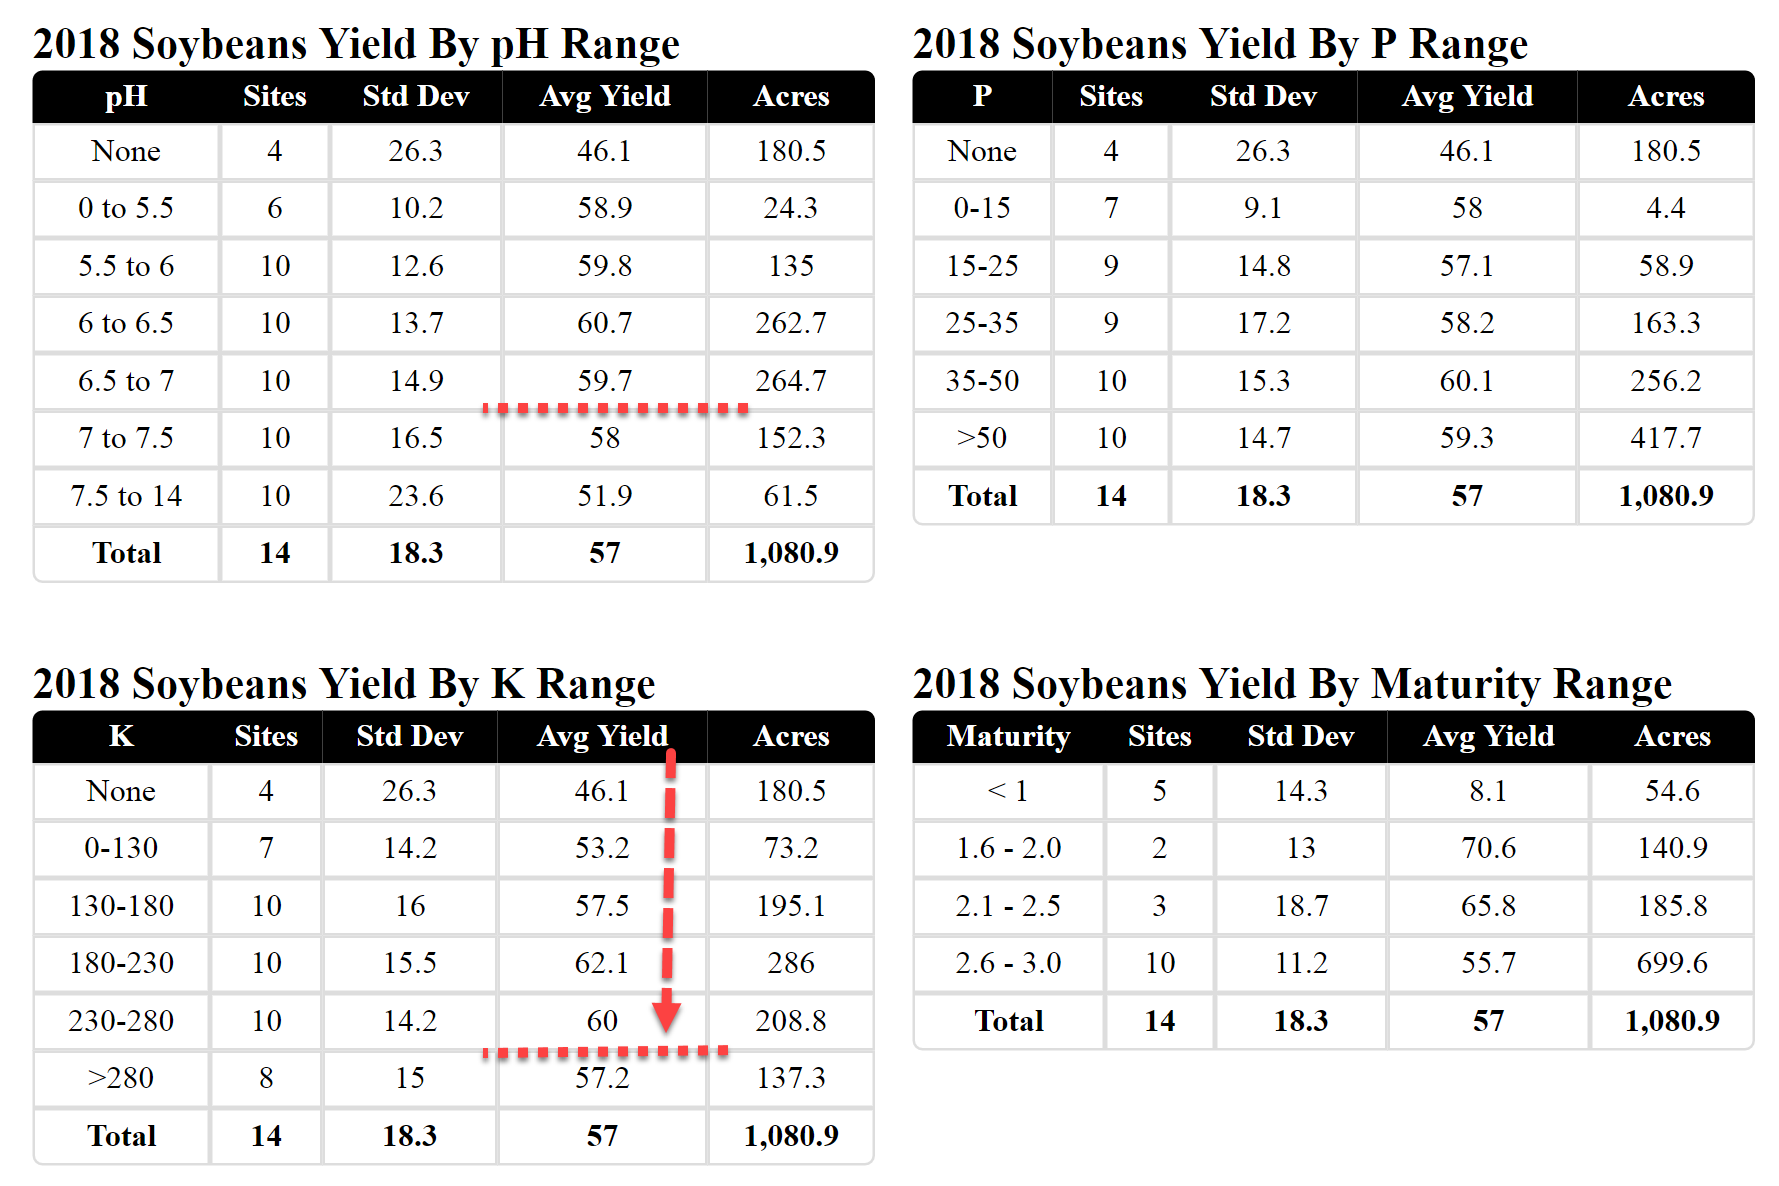
For these examples, it is a great look at where optimum may be and where to dig deeper at the field level to discover more. Also, It shows that the 180.5 sites that do not have sampling data are yielding significantly less than those that do. Could help you to have a great conversation with a grower!
If you wish, you can combine years to look at averages, as well!